

Sector Update / Banks / Click here for full PDF version
Author(s) : Jovent Muliadi ;Anthony
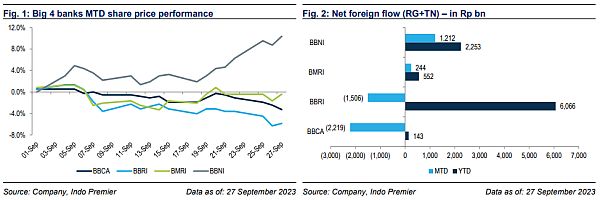
- BNI recorded Rp1.2tr of foreign flow MTD and brought overall YTD inflow to Rp2.3tr, second only to BRI at Rp6.1tr. This resulted in 10% mom gain.
- We believe the rally was due to: 1) improvement on its loan growth, 2) valuation catch-up against and 3) positioning switch from BRI.
- We look at this from two sides; on a positive note, foreign positioning is still way off its peak in FY17 (only back to FY19) but on the other hand, we think that upside from fundamental is limited (loan growth/ROE).
Surge in MTD foreign flow to BNI
BNI outperformed the rest of the banks in Sep by staggering amount (+11-16% against /BBRI/BBCA) which attributed to the surge in foreign flow (at Rp1.2tr MTD vs. -Rp2.2/-1.5tr for BCA/BRI; recorded Rp244bn of inflow). The question was why Sep in particular and we suspect this due to: 1) improvement in loan growth (Aug loan growth at 8% vs. 5% in Jun - partly due to BNI's low base effect in Aug22), 2) valuation catch-up against (BNI trades at 1.1x FY24F P/B vs. 's 1.9x P/B), 3) positioning switch from BRI, this we think due to the concern on weak results and higher-for-longer rate which is -ve for BRI; lastly to lesser extent was the excitement post EGM (i.e. stock split and change in BOC).
P/B-ROE trade-off remains attractive but PPOP /equity trajectory is also imperative to justify the re-rating
YTD flow of BNI recorded at Rp2.3tr, second only to BRI at Rp6.1tr whereas /BCA at c.Rp500/100bn of inflow. We think that the foreign is overly bullish on the aforementioned reasons and most are too fixated on P/B-ROE differential with - the main argument is that BNI P/B of 1.1x is at a deep discount considering its 15% ROE vs. 's 21% ROE but 1.9x P/B.But if we use PPOP /equity instead of profit/equity, we found that BNI ratio is at 25.3% (only back to 2018 level) vs. /BBRI at 35.3/34.9% (where 2018 was at 27%). We use this ratio as most of the BNI earnings was driven by lower provision( PPOP growth at +5% in 8M23 vs. of +18%).
Liquidity is our concern for BNI's loan to continue to pick-up
At the same time, BNI Aug23 LDR is the highest at 91% vs. /BBRI at 87/89% and with the 9% RR, we don't see its loan growth (8% yoy in Aug23) to accelerate further without at the expense of CoF/NIM. This has been reflected on its 8M results as its savings growth was at -2% yoy vs. +7% yoy; BNI's TD rose by 8% yoy (+4% mom) vs. -4% yoy (-2% mom) supporting our thesis that its NIM may be at risk.
Fund positioning suggest that there is still room for more inflow
We think the surge in BNI lately was due to the fact that continued to break new high YTD. However, has structural transformation especially on its funding (link to our note) also warranted a re-rating and hence, remains as our top pick. Separately, foreign positioning in BNI is still way lower than its peak in FY17 (at 4.5%) vs. current 2.5%; whereas local positioning also suggest that there is still room to catch-up (OW JCI by 1.3% and absolute weight of 3.8% even lower than Dec22 4.6% vs. /BBRI UW of -1.4/-0.2%). In terms of PE, now BNI trades at 8.2x FY24F P/E vs. 10x, both are attractive in our view.
Sumber : IPS